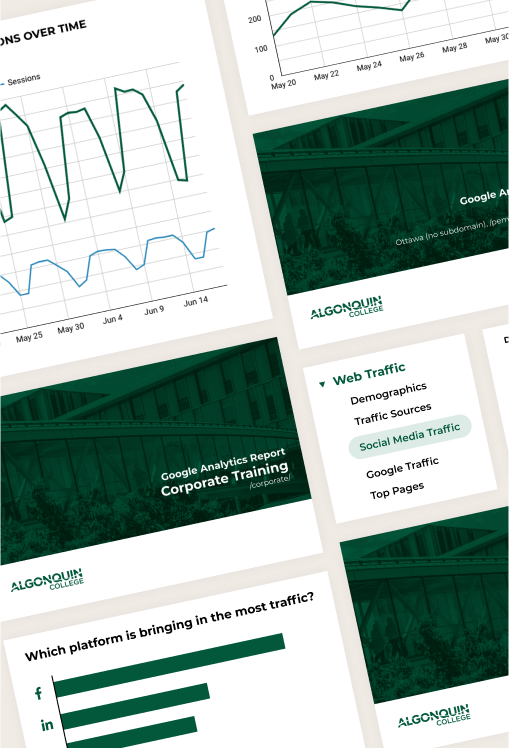
Tired of looking at numbers that don’t help you decide?
We hear it all the time:
“I have Google Analytics but don’t know what to look at.”
“Our reports show engagement... but not results.”
“Stakeholders want ROI, and I can’t give them a clear answer.”
“Our ad spend is growing but I don’t know what’s converting.”
“Every platform has its own data – nothing connects.
Sound familiar? That’s exactly where we come in.
We work with clients who want better answers
Whether you’re a…
- Non-profit trying to report on real-world impact
- Service provider aiming to generate more qualified leads
- E-commerce business trying to tie revenue to marketing spend
…we’ll help you uncover insights that drive smarter marketing decisions.
Our analytics toolbox

Google Analytics 4 (GA4)
Event-based behavior tracking

Google Tag Manager (GTM)
For custom events and tracking triggers

Google Search Console (GSC)
Organic performance and technical insights
Looker Studio
Clean, visual dashboards designed for quick interpretation
Need help migrating, auditing, or cleaning up these tools? We’ve got you.
We don’t just track metrics. We help you use them to make smarter decisions.
Conversion rates
Your conversion rate tells you how well your site is turning visitors into action-takers, whether that’s form submissions, donations, or purchases.
We help you:
- Benchmark your performance against industry standards (e.g., 2–4% for e-commerce, 1–3% for awareness-based nonprofits)
- Identify bottlenecks on key pages that are getting traffic but not converting
- Test landing pages and CTAs to improve results over time
Example: A client had strong traffic but a 0.4% conversion rate. We diagnosed friction points on the form page, redesigned the flow, and lifted conversions to 2.1%.
Channel performance
Not all traffic is equal. We break down your data by source—like Google, Facebook, LinkedIn, email, or referral—so you can see which channels actually lead to results.
We help you:
- Compare conversion rates across channels, not just clicks
- Reallocate ad budget toward higher-performing traffic sources
- Spot underperforming campaigns before they waste spend
Example: One non-profit saw high social engagement but no conversions. Organic search drove fewer users – but 3x more donations. We shifted focus to SEO and ran targeted campaigns aimed at users with a higher likelihood of donating.
Reverse-engineered traffic goals
Once you know your conversion rate, you can work backwards to set realistic traffic and budget targets.
We help you:
- Forecast how much traffic you need to hit monthly lead or revenue goals
- Plan ad spend more effectively by understanding cost per conversion
- Build clear marketing funnels tied to measurable KPIs
Example: A service provider needed 10 new leads per month. With a 2% site conversion rate, we calculated they’d need 500 monthly qualified visitors and built a paid strategy to help them get there.
What’s included in a U7 analytics work plan?
Discovery
We align on your goals, pain points, and KPIs.
Audit
We review your current setup, spot tracking gaps, and identify low-hanging fruit.
Setup or cleanup
We configure or improve GA4 (Google Analytics), GTM (Tag Manager), and GSC (Google Search Console) to ensure accurate and meaningful data.
Custom dashboard design
We build interactive dashboards that show you what matters, whether it’s weekly conversions, ad spend, or grant-based outcomes.
Interpretation & support
We don’t just deliver a report – we walk you through it and help you apply the insights.
What our clients are saying
Let’s make your data useful
If you're done with unclear reports, scattered metrics, or not knowing how your site is really performing – it's time. Let’s build you a dashboard that simplifies your data and fuels growth.

