


"*" indicates required fields
6 Benefits of Digital Marketing Analytics Reports for Your Non-Profit
In a world where digital landscapes shift constantly, having a finger on the pulse of your marketing efforts is more crucial than ever, especially for non-profits where every resource counts.
Analytics reports aren’t just numbers on a page; they’re a roadmap to smarter decisions and stronger strategies.
Let’s start by explaining what they are a bit further and then how they can transform your nonprofit’s approach to digital marketing.
Firstly, what is a digital marketing analytics report?
A marketing report nowadays is typically built using a tool that can give you data in real-time and allow for date filtering. It aggregates data from your various marketing activities to assess their performance.
This is a screenshot of our personal marketing dashboard, which is built using a tool called Looker Studio.
We have a variety of pages in the dashboard that divide and organize the data from our various tools in a way that we found useful and easy to use. We customize the pages, elements and filters ourselves.
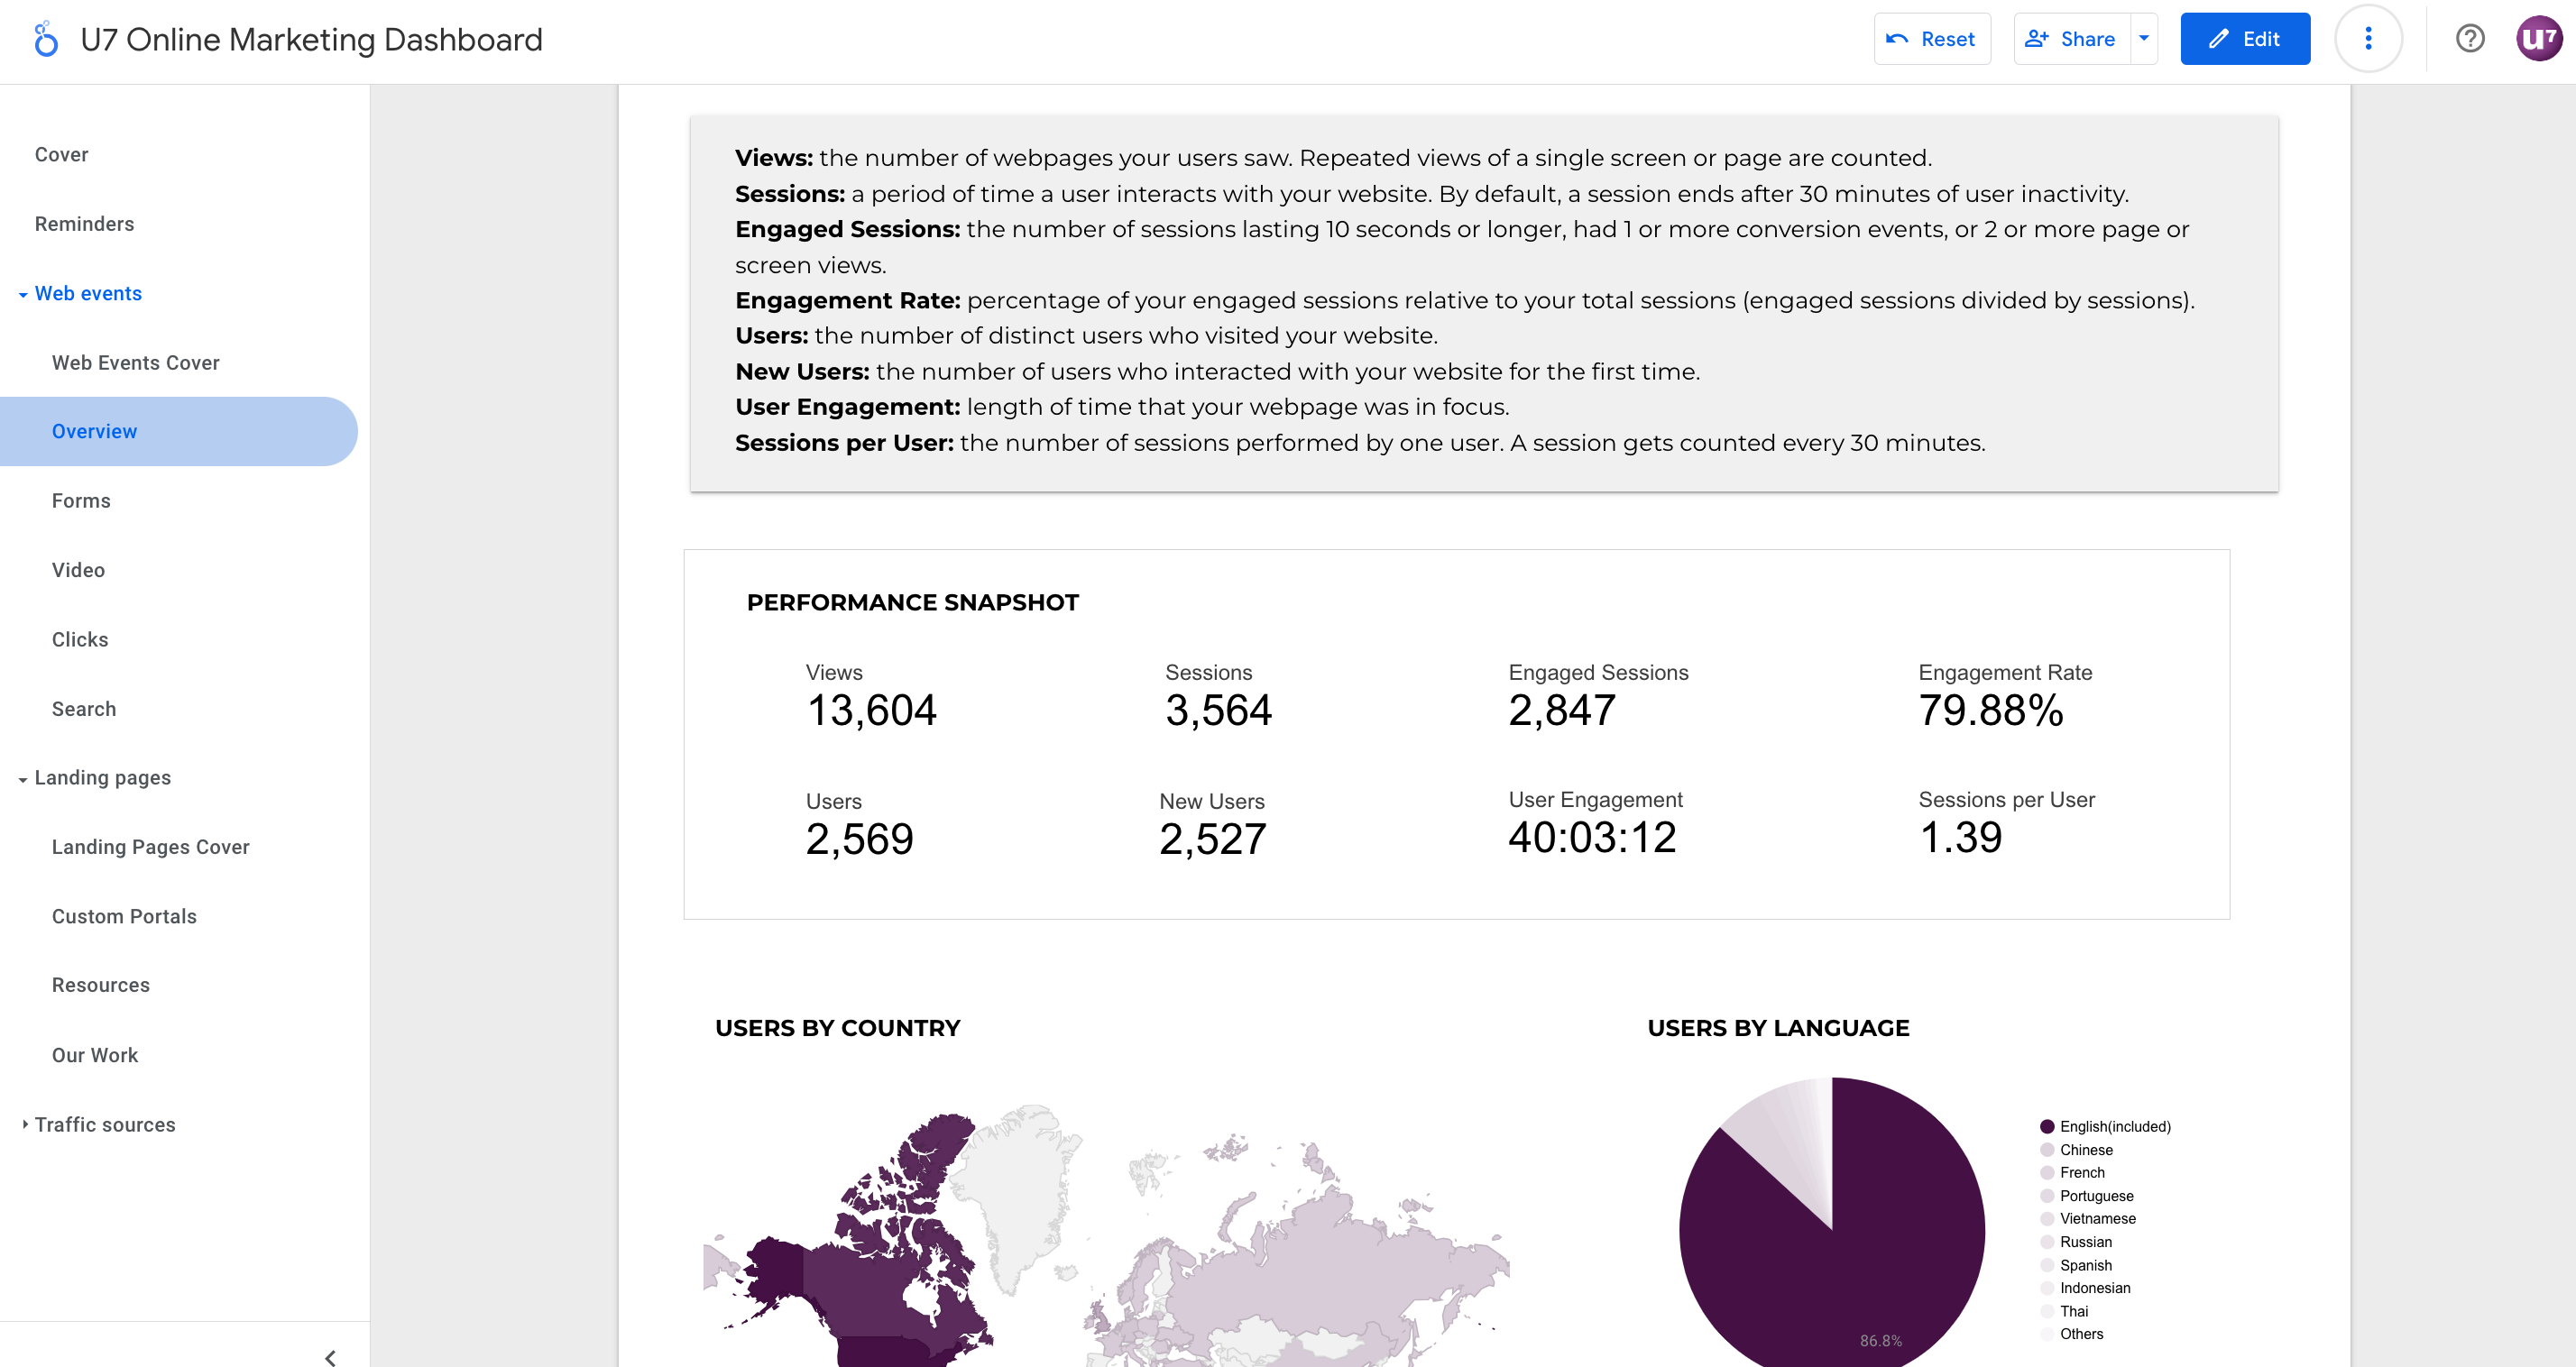
A marketing analytics report usually includes details from a variety of marketing tools and channels, such as web traffic, social media engagement, PPC (pay-per-click) campaigns, and SEO (search engine optimization) efforts.
This report helps you understand what’s working, what isn’t, and how close you are to achieving your marketing goals. If you’re curious about how to set your marketing goals, read our other article about Choosing and Tracking the Right KPIs for your Non-Profit.
By analyzing trends, pinpointing successes, and identifying areas for improvement, these reports enable your non-profit to make informed decisions to enhance your digital presence and overall strategy.
Here are six benefits of analytics reports for your non-profit
1. Monitoring mission-aligned progress and reporting on KPIs
From tracking spikes in web traffic to watching your organic reach grow, marketing reports offer clear insights into your successes and areas needing attention.
Let’s say your online presence and growth is a top priority.
One of the ways to measure that is through your social media following and engagement.
You can take a look at all your social media accounts data at a glance and understand how many followers you gained, posts were made, and other important metrics within a specific timeframe.
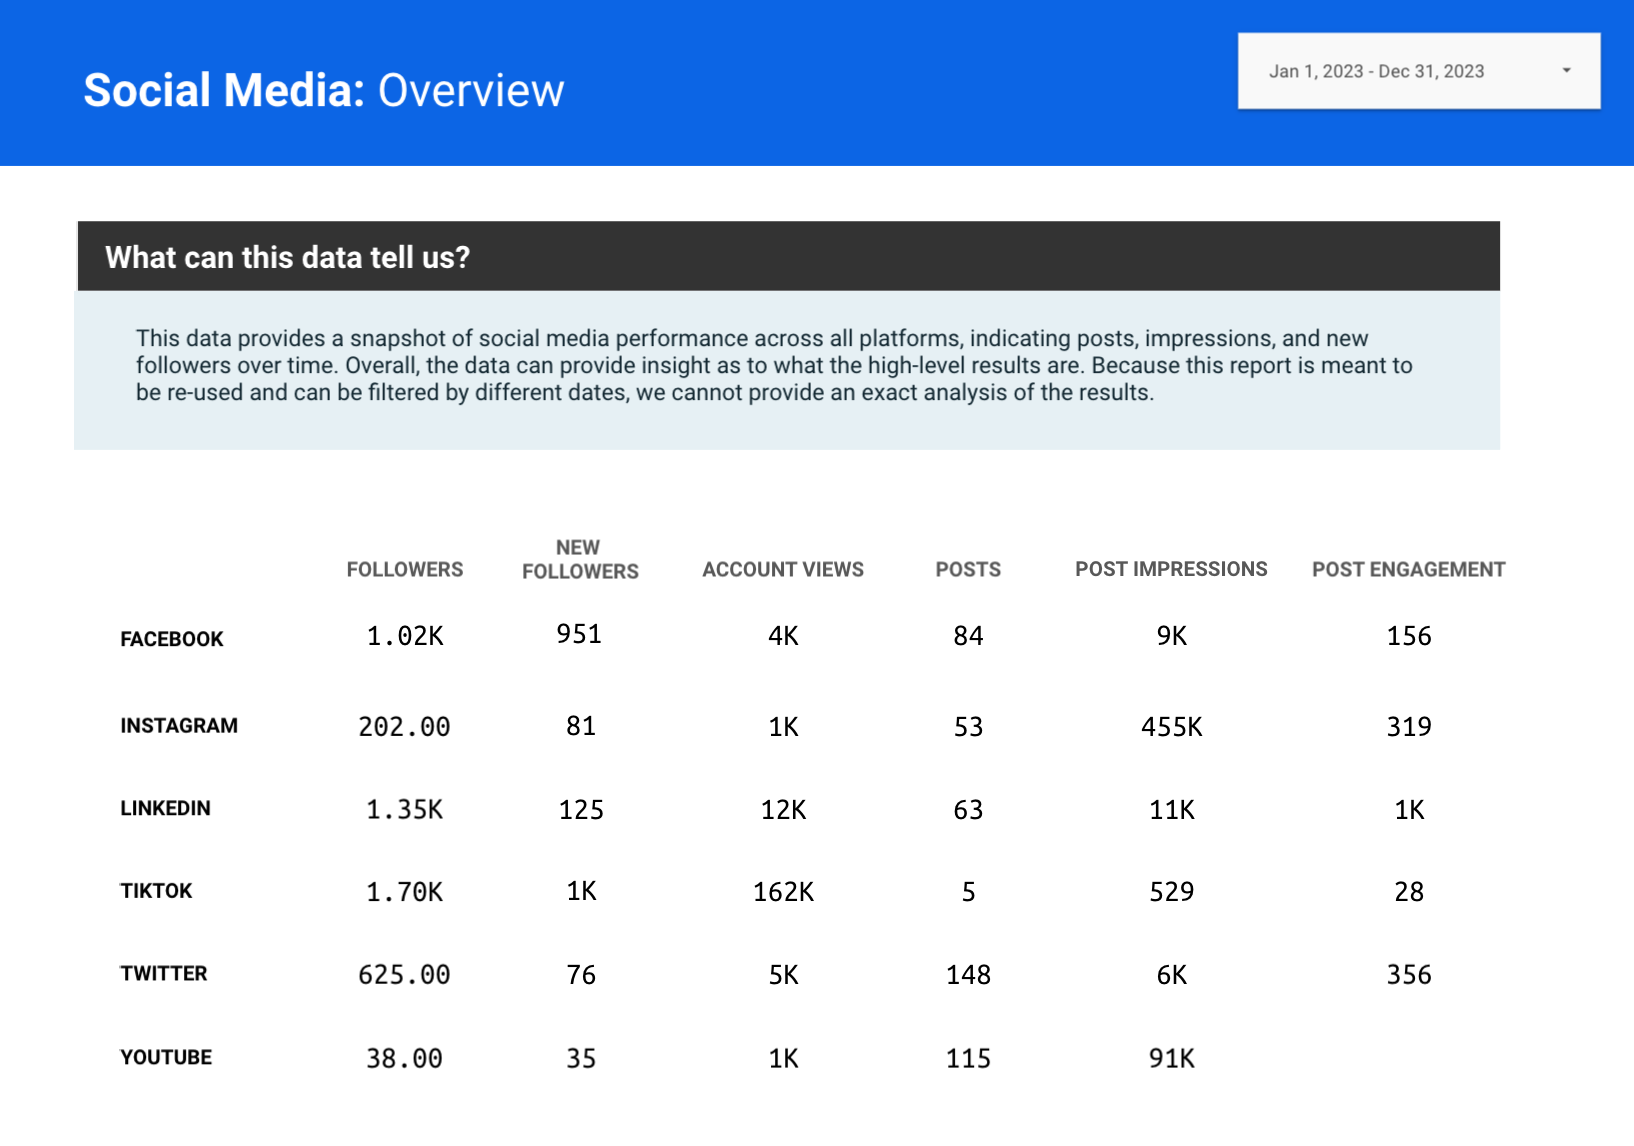
For instance, the data from the provided snapshot shows:
- Facebook has significantly increased its followers by 951, with a total of 4,000 account views and 156 post engagements, suggesting a steady growth and moderate engagement rate.
- Instagram, while smaller in follower count with 202 new additions, boasts a remarkable 455K post impressions and 319 engagements, indicating a highly engaged audience that interacts frequently with the content.
- TikTok displays explosive growth with 1,000 new followers and an impressive 529 post impressions from just 5 posts, highlighting its efficiency in reaching a broad audience with fewer content pieces.
- LinkedIn and YouTube show different challenges; LinkedIn, with a modest increase of 125 followers, has a significant number of account views (12K) but lower engagement (1K), suggesting content or outreach may not be resonating as effectively as possible. YouTube, despite a high number of impressions (91K), sees only 35 new followers, indicating potential issues with content conversion or audience retention.
Such detailed metrics help assess which platforms are most effective at engaging your target audience and where to adjust your efforts.
For example, while Instagram and TikTok demonstrate high engagement and efficient content reach, strategies for YouTube and LinkedIn may need reevaluation.
YouTube’s strategy might particularly require a shift towards more engaging or varied content forms to improve follower conversion rates.
This kind of analysis not only helps pinpoint successful tactics but also identifies areas where your digital strategy may not align as effectively with audience expectations or behaviors.

Boost your online presence with our help
- Web design and development
- SEO and PPC
- Social media strategy
- AI technology
Leveraging this information can guide strategic adjustments to enhance engagement and follower growth across all platforms.
2. Marketing budget allocations
Make confident, informed decisions that maximize resource efficiency and ensure your donor dollars are making the biggest impact.
Say you, your boss, or stakeholders are unsure whether you should continue to invest in Google Search Ads.
You can take a look at your web sessions by “channel” to benchmark the performance of your Google Ads against other traffic sources to your website.
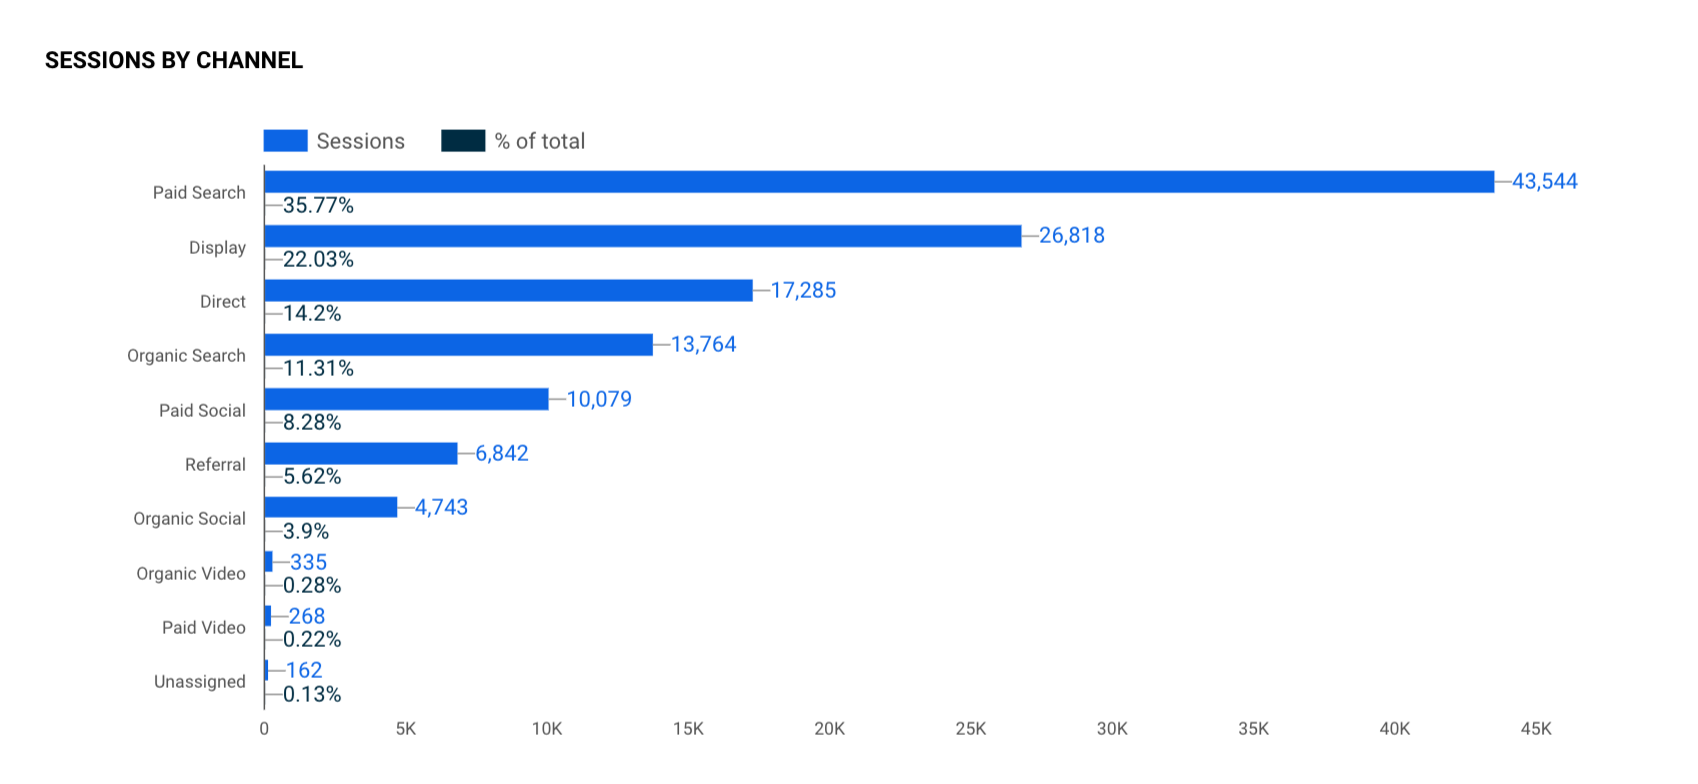
From the data above, it becomes clear that Paid Search is the dominant source of web traffic, accounting for 35.77% of total sessions.
This substantial portion suggests that Google Ads are indeed effective in drawing visitors to your site.
Given this insight, it may be prudent to not only continue your investment in Google Ads but also consider optimizing your campaigns to further increase their efficiency.
By analyzing specific metrics like conversion rates and cost per acquisition from these ads, you can fine-tune your strategies to ensure you’re getting the best return on investment.
This approach not only confirms the impact of your current spending but also guides you on how to allocate your budget more effectively, ensuring every dollar contributes towards reaching your non-profit’s goals.
3. Refining paid ad campaigns
Understanding how to optimize paid advertising efforts is crucial for maximizing your non-profit’s digital strategy ROI.
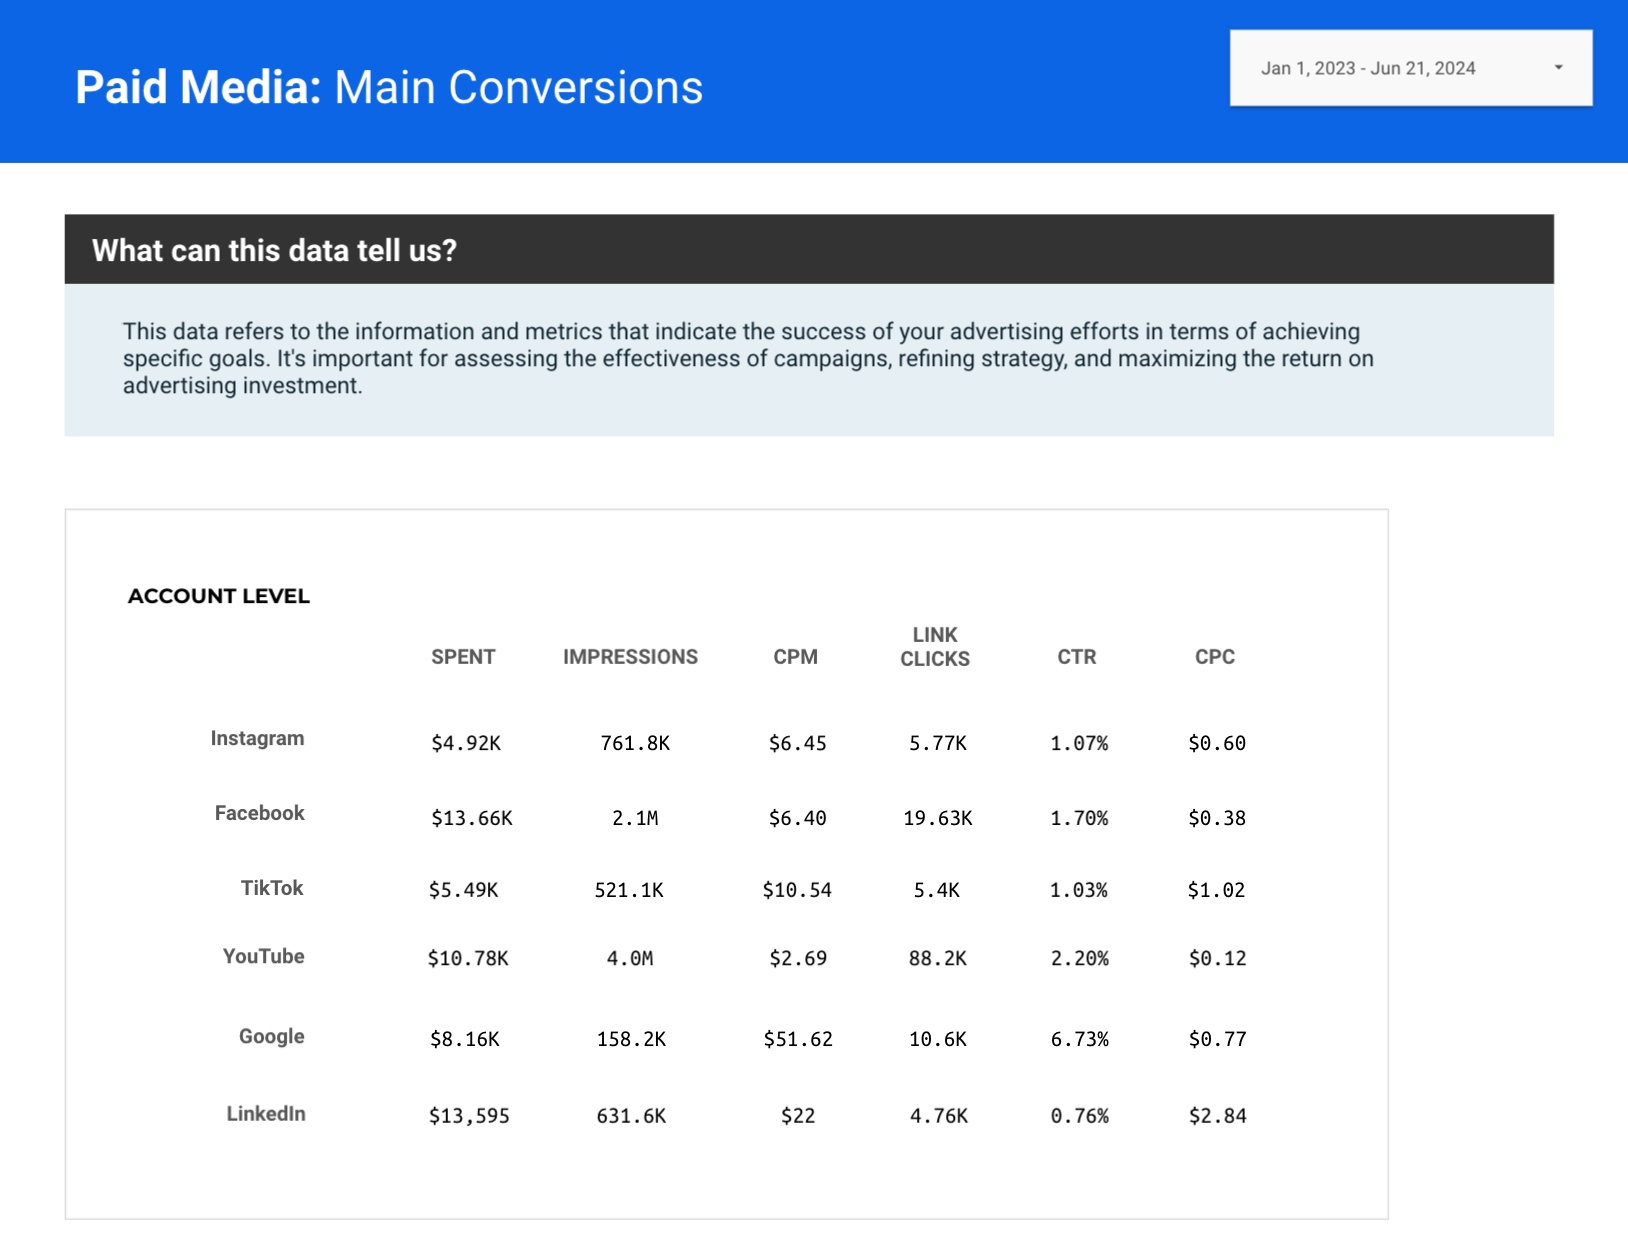
Consider the example above:
- Google Ads shows a high click-through rate (CTR) of 6.73% with a cost-per-click (CPC) of $0.77. Despite the relatively high cost per impression (CPM), these ads are effective in driving conversions, demonstrating their potential value in a focused campaign.
- Facebook Ads illustrate a balance between cost efficiency and broad reach, with a CTR of 1.70% and a low CPC of $0.38, alongside significant impressions at 2.1 million. This suggests they could be a cost-effective choice for campaigns aiming to enhance visibility and engagement.
- YouTube emerges as an excellent platform for engagement in this scenario, with a low CPC of $0.12 and a CTR of 2.20%, indicating strong engagement per dollar spent, ideal for awareness and engagement-focused video campaigns.
- On the other hand, LinkedIn shows a high CPM of $22 with a lower CTR of 0.76%. This example indicates that while LinkedIn might effectively reach professional audiences, the cost per engagement might not justify its use in every campaign, especially those with stringent budget constraints or specific conversion objectives.
By regularly reviewing such metrics—spending, impressions, CTR, and CPC—non-profits can learn to refine their strategies to emphasize more on platforms that yield higher engagement rates and better conversions per dollar spent.
This approach not only optimizes PPC campaigns but also ensures that marketing budgets are effectively used to support key organizational goals like increasing donations, member sign-ups, or program participation.
4. Boosting organic search impact
SEO (organic search) is a game of precision, and regular SEO reports help you fine-tune your efforts for better rankings and greater visibility.
By analyzing which search terms are leading to traffic on your website, you can optimize your content to target the most effective keywords.
This allows you to enhance the relevance of your pages to specific search queries, improving both the quantity and quality of your traffic.
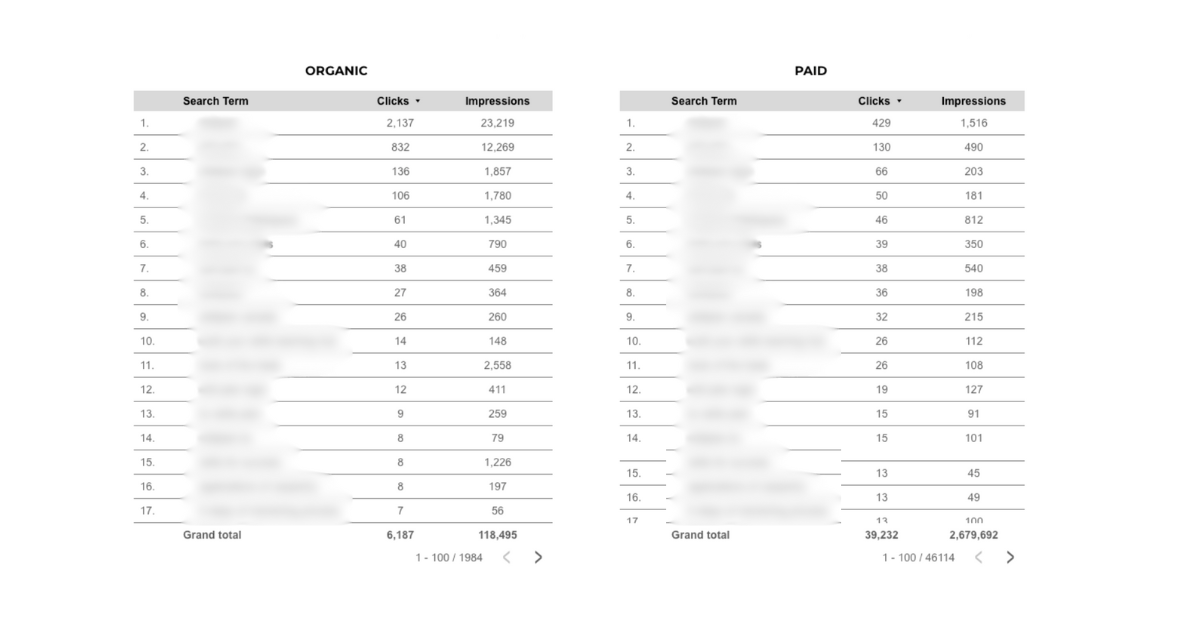
For instance, examining the organic search terms from this report above, you notice significant clicks for certain keywords, like the top term which alone brought in over 2,000 clicks with nearly 24,000 impressions.
This indicates a high interest and a strong match between user intent and your content. On the other hand, paid search shows different keywords being targeted with varying degrees of success.
For example, the top paid search term gathered 429 clicks from 1,516 impressions, which while effective, might not be as cost-efficient as optimizing your site to capture similar traffic organically.
You can also compare your organic search terms with your paid search terms to ensure you’re not overlapping efforts and strategizing as best possible. For example, if various keywords are already leveraging great organic clicks from Google, you may not need to focus on those in your paid strategy.
This analysis helps in allocating your budget more effectively, focusing paid efforts on terms that do not perform as strongly organically but could benefit from the additional boost, while continuing to strengthen your organic search presence where it is already strong.
By systematically evaluating and adjusting your SEO and PPC strategies based on detailed keyword performance data, you maximize your online presence and ensure a more efficient use of your marketing resources.
This strategic approach not only optimizes your expenditure but also drives higher engagement and conversions by targeting users with precision.
5. Understanding demographics
These reports can reveal information about your website demographics.
Identifying the most commonly used languages, cities, and countries helps tailor content, support, and marketing materials to primary audiences, enhancing engagement and satisfaction.
Understanding user distribution aids in effective resource allocation and reveals market opportunities for growth.
Recognizing key demographic trends supports targeted marketing efforts, while identifying underrepresented segments highlights new opportunities for expansion and user acquisition.
This data-driven approach ensures that content and services are culturally relevant and aligned with user needs, optimizing the overall user experience.
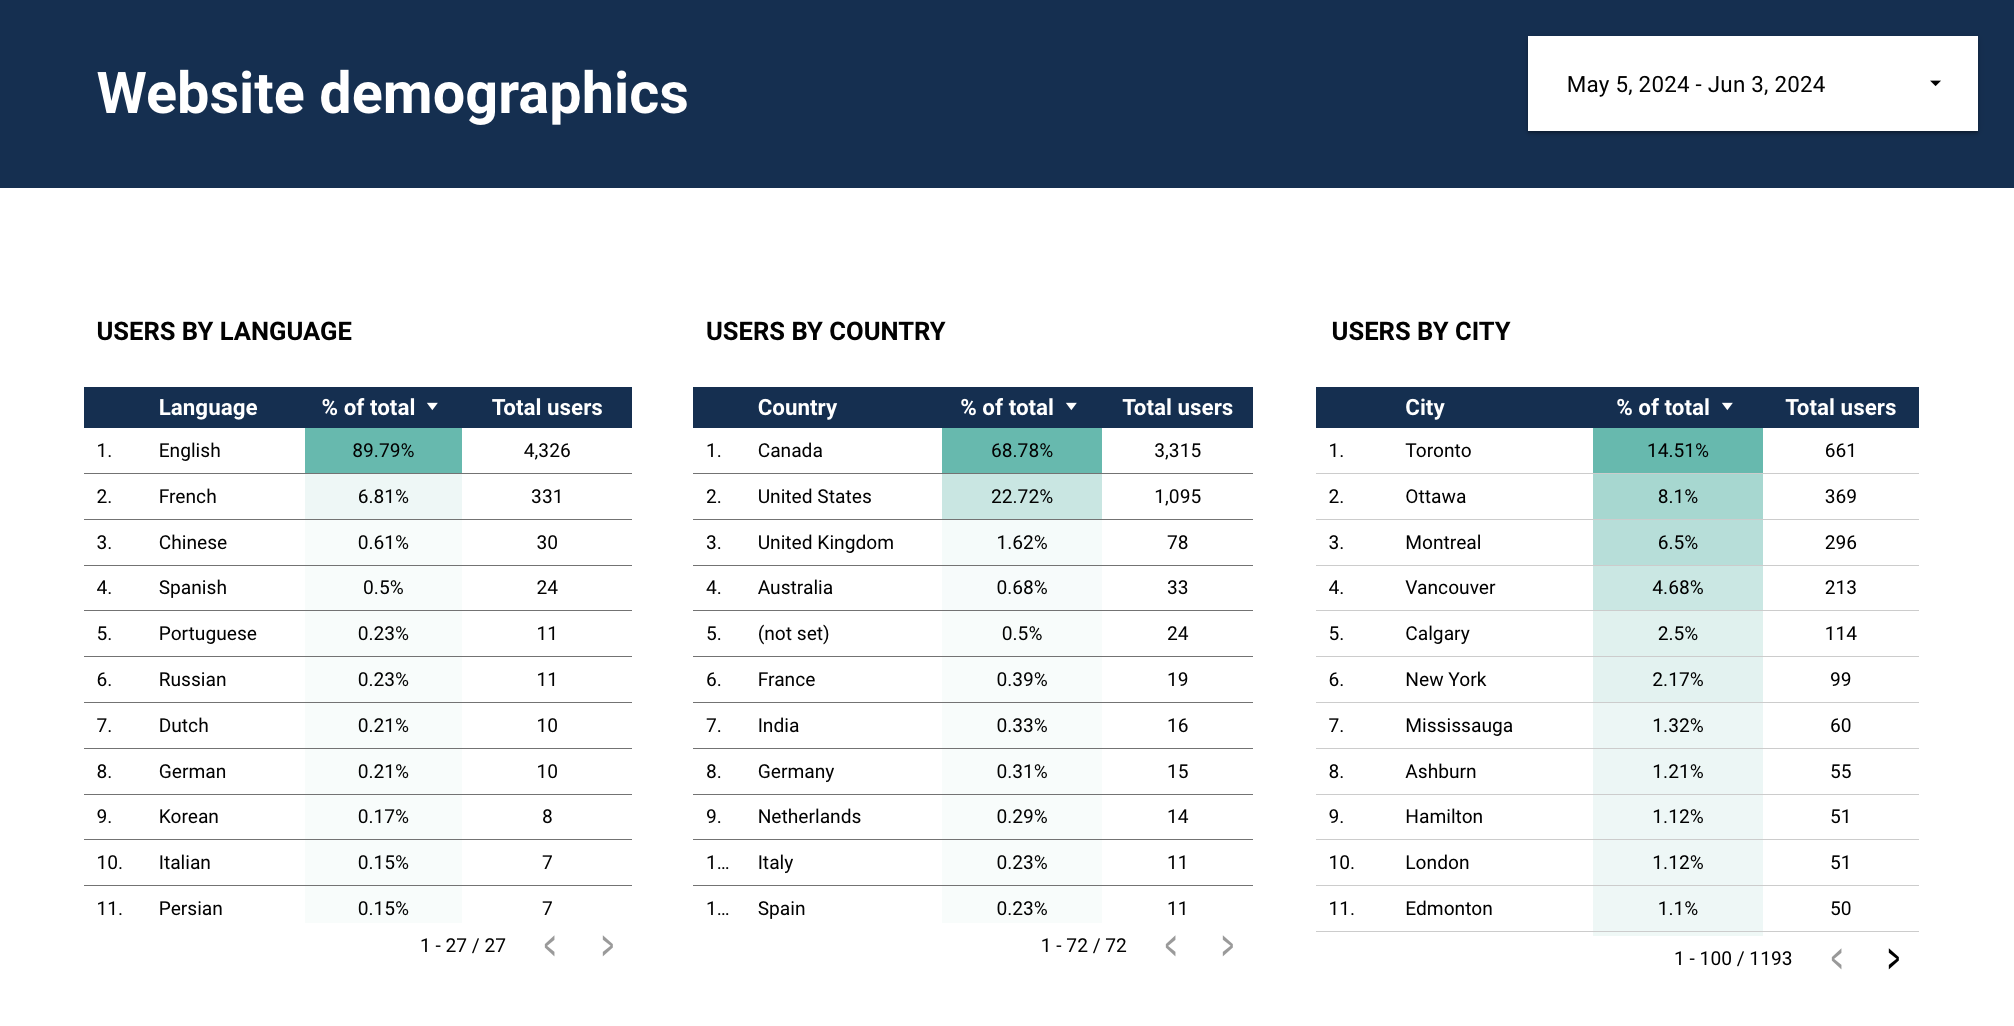
For instance, consider this example where a demographic report shows that 89.79% of a website’s users prefer English, with the majority residing in Canada (68.78%), including significant user bases in cities like Toronto (14.51%) and Ottawa (8.1%).
This information suggests a strong focus on English content, while also emphasizing the importance of cultural and regional nuances in marketing efforts.
Additionally, understanding user distribution helps in allocating resources effectively. If the data indicates a smaller yet notable percentage of users in French-speaking areas such as Montreal (6.5%), there might be a strategic opportunity to boost engagement by increasing French language support and content, tapping into this segment more effectively.
Recognizing key demographic trends supports targeted marketing efforts. For example, if users are predominantly located in specific cities or regions, localized advertising campaigns or community events could be highly effective.
Moreover, identifying underrepresented segments, such as Spanish or Chinese speakers who make up smaller portions of the audience, can highlight opportunities for expansion and user acquisition by developing content that caters to their unique needs.
6. Promoting transparency and accountability
Imagine if a sports team could see real-time stats on how each player’s actions contribute to the game’s outcome.
Similarly, with comprehensive digital reporting, every member of your marketing team can see the direct impact of their efforts, much like athletes seeing their performance stats during a game.
This visibility not only boosts individual accountability but also enhances the collective drive towards shared objectives.
By maintaining regular digital reporting, you can keep everyone in the loop, ensuring that each team member is not only informed but also aligned with the common goals.
This fosters a transparent environment where strategic collaboration drives mission success, similar to how a coach uses real-time data to adjust strategies during key moments in a game.
For example, consider a marketing team working on an email campaign. With access to real-time data, each member can see how adjustments to email subject lines or timing affect open rates and conversions.
This not only encourages a more analytical approach to task execution but also helps in quickly identifying successful strategies and areas needing improvement.
Regular digital reporting promotes a culture where data-driven decision-making is the norm.
When team members can see how their contributions directly impact the organization’s overall performance, it not only fosters a sense of ownership and pride in their work but also encourages a more engaged and motivated team.
This transparency leads to more effective collaboration, as team members are more likely to share insights and solutions, knowing exactly how their actions help achieve the broader goals.
Conclusion
Embracing marketing analytics reports equips your non-profit with the insights to thrive in the digital realm.
They’re not just reports—they’re the backbone of your strategy, driving progress, optimization, and accountability.
Haven’t started yet? Reach out to us at U7 Solutions.
Let’s empower your non-profit with the insights you need to excel.
Related posts


Book a free consult to discuss your goals
Swipe up for expert help!