


Improve your website in 2022 with these easy-to-track metrics
As a small business owner you probably have a lot on your plate. So, thinking about website analytics is probably low on your priority list and we don’t blame you… Running a business is hard work!
But, after putting so much of your time and effort into designing a website that represents your business, wouldn’t you love to know if it was worth it? Imagine baking a cake for the first time, serving it to your family and friends, and never finding out if they liked it, how it tasted, or if they went back for seconds.
That’s exactly the type of valuable information you can gain from analytics. Luckily, you don’t have to put your baking skills to the test for some feedback on your website’s performance. All you need to get started is a free tool from Google called: Google Analytics (GA).
DISCLAIMER: This article depicts examples using GA’s Universal Analytics. Not GA4.
Don’t fret. I know the world of Analytics can be intimidating. To ease you into it, I’ve outlined some of my favorite metrics to track for SMBs and explain why you should care about each of these with some examples you can apply towards your own business.
Acquisition
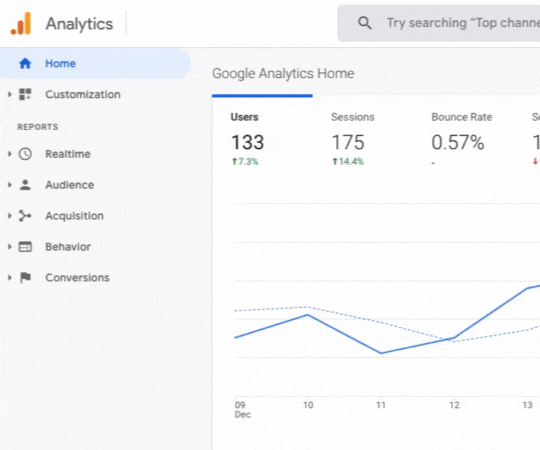
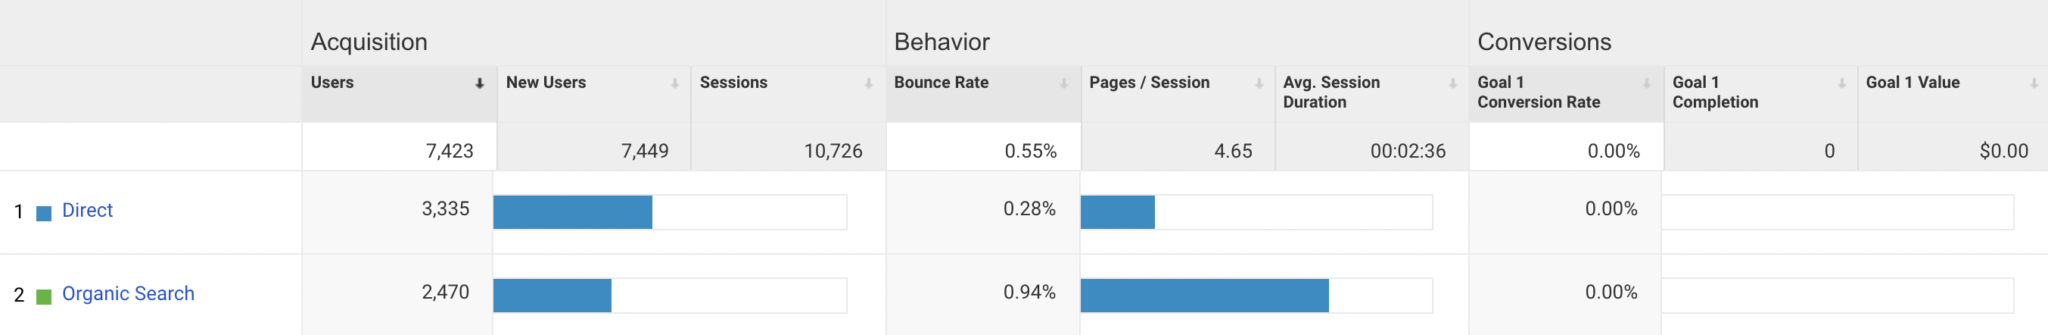
In GA, Acquisition is just a fancy word for saying “where your users are coming from”. The nicest thing about this metric is that you don’t need to do anything in particular to gain access to this information. Google takes the liberty of organizing your website’s traffic into predefined channels groupings which I define for you below. You can access this report by going to Acquisitions > Overview.
Direct: Users who have entered your site by directly typing a URL from your site.
Organic Search: Users who have entered your site from a search engine such as Google or Bing.
Referral: Users who have entered your site via a link that was found on another website.
Social: Users who have entered your site via a social app such as Facebook or Reddit.
Email: Users who have entered your site via a link found in an email (includes email signature links).
Other: If Google Analytics is not sure where your users have come from, this is where they’ll be classed.
Other channels not depicted above might include:
Paid Search: Users who have entered your site by clicking on one of your paid search ads which appear at the top of search results.
Display: Users who have entered your site via display ads such as banner or image ads typically found on other websites.

Boost your online presence with our help
- Web design and development
- SEO and PPC
- Social media strategy
- AI technology
With each of these channels you can find out exactly where your website traffic is coming from as well as their behavior and conversion rate when entering from that specific channel.
Why tracking Acquisition is important
Let’s say you’ve been investing X amount of time into a weekly newsletter campaign with the goal of selling your latest e-book. With GA, you’d be able to find out the number of users who have clicked on your newsletter link, browsed your site, and purchased your e-book. This valuable data can really help you analyze whether or not you’re investing your time and money into the right channels. If your subscribers are not clicking on the newsletter link that brings them to your e-book then you might decide that email marketing is not the best channel to make sales and change your approach.
Next level: Connect your Google Analytics account to Google Search Console to find out exactly what keywords your users are typing to find your website into search engines like Google.
Find out more about GSC here.
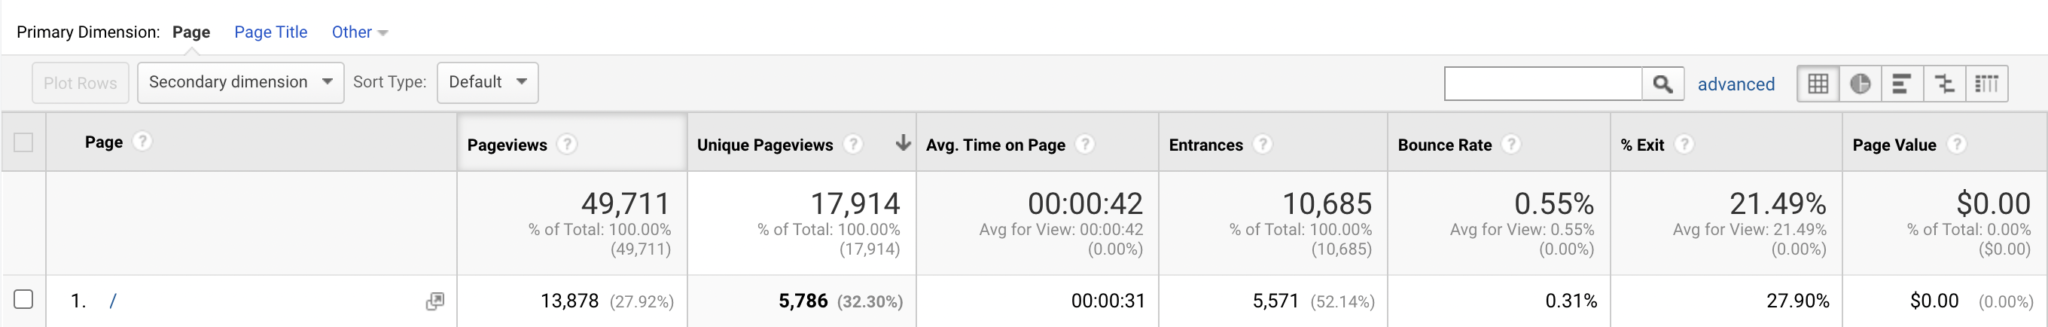
Pageviews
Another simple, but useful metric is pageviews. GA displays page views in two ways:
Pageviews: Total number of pages viewed including repeated views of the same pages.
Unique pageviews: Total number of pages viewed in a single session without counting repeated views.
Session: A collection of interactions taken by a user on your website during a given time frame. (NOTE: If a user visits your site, stays on a page for 30 minutes without any activity, the next action taken on the site will be counted as a new session.)
For detailed information of every page on your site, you can access pageviews by going to Behavior > Site Content > All Pages.
Why tracking Pageviews is important
Being able to distinguish between total pageviews and unique pageviews will allow you to see which pages bring you the most traffic. This can give you a better idea on the type of content your users are interested in and help you decide the type of content you should be putting on your website.
Let’s say you’re a photographer and you’re thinking of starting a blog, but you’re not sure what type of content your viewers would be interested in. By analyzing your current page views, you can determine which pages are bringing in the most traffic and base your blog topics off of those pages.
For example, if your top three pages are your services pages for weddings, newborns and maternity shoots, then perhaps your audience would be interested in learning more about these types of sessions through your blog.
Avg time spent on page/Session duration/Bounce rate
With GA, calculating a period of time is not as straightforward as you might think. Let’s start with defining these similar yet distinct metrics:
Average time on a page: How long your visitors spend on average on a single page.
Session duration: How long your visitors spend on average on your website overall in a single session.
Bounce rate: The percentage of visitors who have viewed a single page of your website without taking any further action other than leaving your website.
Once you start exploring GA, you’ll notice these metrics are used across different reports. The easiest places to access this information would be by going to Acquisitions > Overview and/or Behavior > Site Content > All Pages.
As I mentioned, GA’s way of calculating time isn’t straightforward so you’ll want to remember to ALWAYS give these metrics context prior to analyzing them. Without context, you’ll likely be making inaccurate assumptions about your website.
You see, in order for Google to be able to calculate time on your site, it needs to be triggered by a user’s actions. This can be loading a page, watching a video, or clicking a link, just to name a few. Without these triggers, Google cannot identify if a user is on your site or if they have left. Therefore, if no action is taken, due to inactivity or the lack of triggers on a page, Google just assumes the user has left and sets the time spent at 0 and the bounce rate at 100%.
Here is an example with more context:
Scenario 1: A user enters your website via your most recent blog post, spends 30 seconds glancing at it, then exits your site. Since no action was taken, time spent is 0.

(Source)
Scenario 2: A user enters your website via your most recent blog post, spends 30 seconds glancing at it, then decides to read the next blog post advertised at the bottom of the page. Since the user took the action of loading a new page, Google was able to trigger the time and record it.
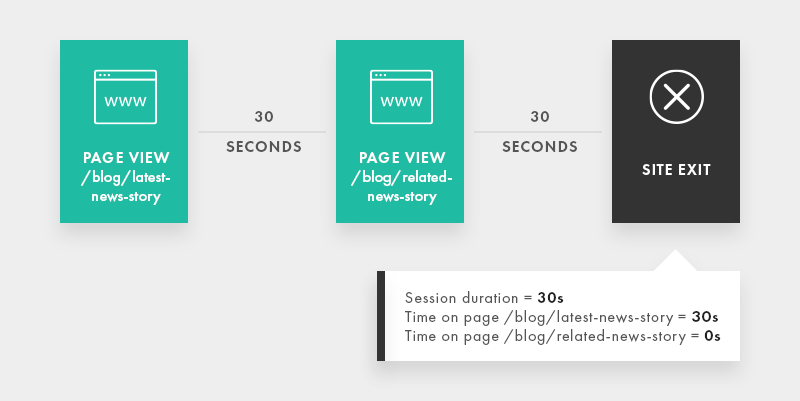
(Source)
Now that you have a better understanding of how Google calculates time, here are some questions you’ll want to ask yourself before analyzing these metrics:
- What type of page is this (blog post, service page, landing page)?
- How much content does the page have?
- Are users supposed to spend a significant amount of time on this page or should they be able to quickly find what they need before moving on?
Why tracking Avg time spent on page/Session duration/Bounce rate is important
Your answers to these questions will help give context to the data in front of you and allow you to make better judgment calls when it comes to the quality of your site and the changes you might need to make.
Let’s say you’ve designed a high converting landing page. Your goal is that people will read through the page in about 5 minutes and then click on a call to action button that leads them to your contact page. In this scenario, the action trigger enabling google to record the time spent on your landing page would be your button at the bottom of the page.
If your analytics display an average time spent on page as being 5 minutes and a low bounce rate, then you can assume that your landing page is appealing to your users and does not need changes as it is successfully bringing people to your contact page.
Alternatively, if your analytics are showing a much lower time spent on page (likely closer to 0) and a higher bounce rate (closer to 100%), then it may be wise to rethink your landing page. Perhaps the page is too long and your users get disinterested before reaching the call to action at the bottom of the page.
Scroll Depth (Bonus metric for the slightly more adventurous)
Now if these easier metrics have gotten you excited about the valuable insights you can gain from analytics, then why not dive a little deeper with scroll depth.
While this metric is simpler to understand in theory, it is more complex in that it requires the use of a secondary analytics tool called Google Tag Manager (GTM).
If this is your first time hearing about GTM and you’re interested in the metric below, then find out how to install it here.
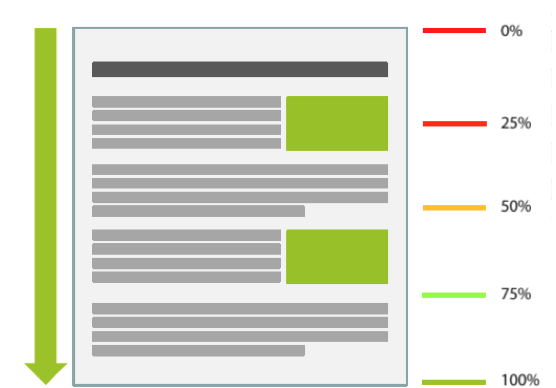
As the name suggests, Scroll Depth can determine how your users scroll on your site. You can determine both your desired scroll threshold and a scroll direction when setting up this metric:
Scroll Depth Threshold/Unit: The numeric value that determines when the trigger will fire. The value is either a percentage or pixel units.
Scroll Direction: Can be set as horizontal or vertical
(Source)
Why tracking Scroll Depth is important
Let’s say you have a homepage with a lot of different features showcasing different parts of your websites. Perhaps you want to find out if your users are actually interacting with this page or if they are skipping immediately to different pages through your navigation menu. By setting up scroll depth tracking, you’ll be able to see how far down your users are scrolling.
If your users are not scrolling further than 25-50%, then it may be worth looking into why this might be the case. Three possible reasons include:
- Site speed: Your homepage isn’t loading fast enough. Did you know that 40% of users say they will abandon a site if it takes longer than 3 seconds to load?
- Content: Your homepage includes content that is irrelevant to your users. According to Google, 61% of users will try a different site if they can’t find what they are looking for quickly.
- Necessity: Users are finding what they need within the first 25-50% of your homepage and want to proceed with the next steps.
Alright. I know.
I’ve given you a lot of information today, but what I’ve been trying to show you is that website analytics can be worth your time, even if you’re an SMB. There is SO much data out there, why not use it to your advantage? In fact, understanding what your users want and improving their experience on your website is a sure way to increase conversions.
Get started today by creating an account and adding the tracking code to your website.
Alternatively, if you really can’t find the time, our team at U7 Solutions can help! From determining the best metrics to analyze based on your website and goals, we can come up with a strategy that will suit your needs.
Related posts


Let's chat about your goals
OR tell us more about you
Swipe up for expert help!